
The Volta Region recorded a 21.17% increase in Internally Generated Funds (IGF) in the 2025 financial year, with total revenue rising from GH₵19.69 million in 2024 to GH₵23.86 million in 2025. This represents an increase of approximately GH₵4.17 million in revenue generated by the region’s 18 districts. The figures were obtained from the Auditor-General’s Reports on the Accounts of District Assemblies for the respective financial years and analysed to assess revenue performance across the Volta Region.
Overall IGF Performance
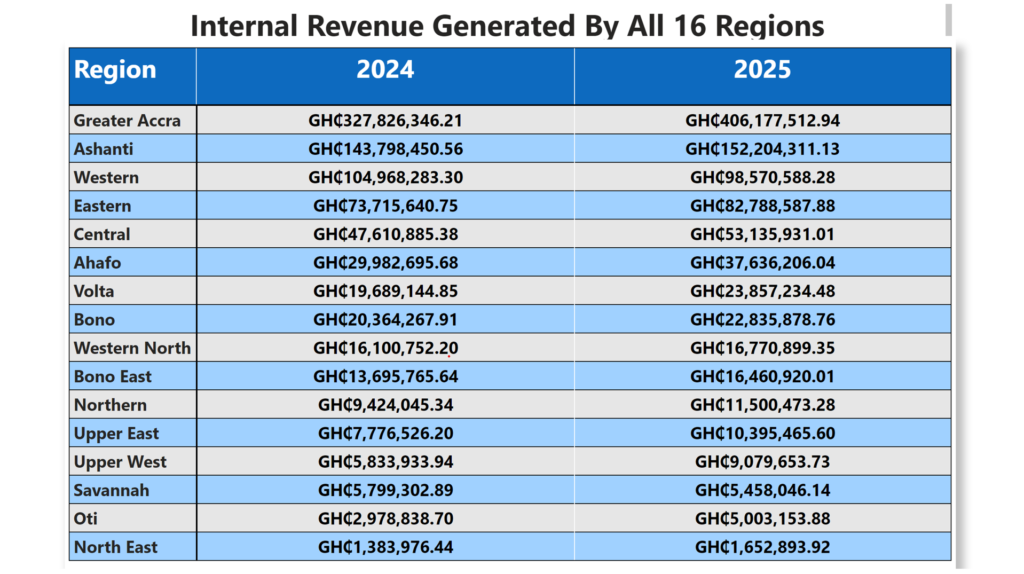
The increase in total IGF indicates that the region’s district assemblies collectively recorded higher revenue collections in 2025 than in the previous financial year.
In absolute terms, the region generated approximately GH₵4.17 million more in 2025, representing a year-on-year growth rate of 21.17%. While this overall improvement is encouraging, examining individual district performance provides a clearer understanding of the factors behind the region’s revenue trends.
Ho Municipal Leads in IGF Generation
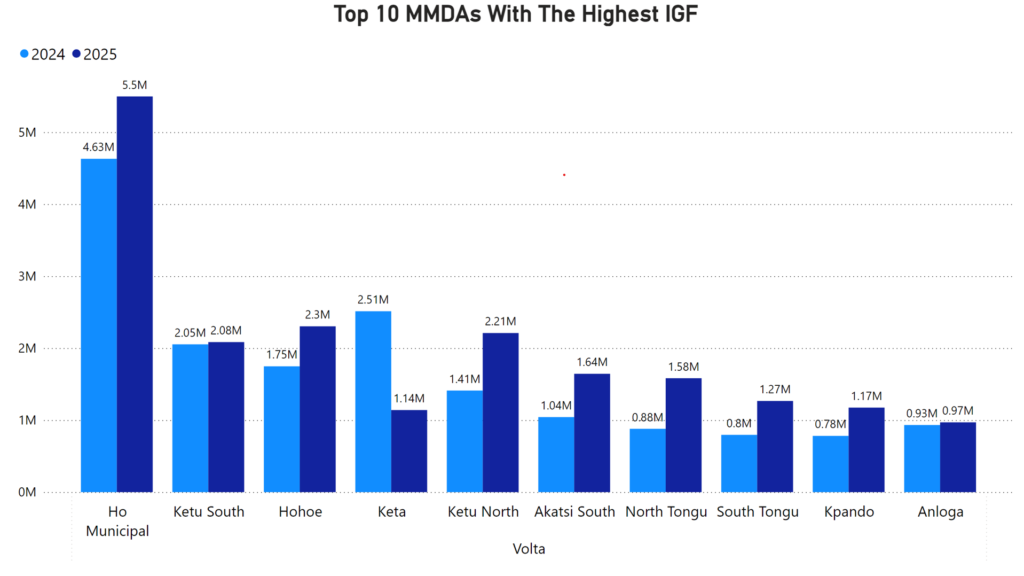
Ho Municipal Assembly remained the region’s leading IGF generator in 2025, recording approximately GH₵5.50 million, compared with GH₵4.63 million in 2024. This represents an increase of about GH₵866,006, or 18.7%.
Ho Municipal’s performance places it well ahead of the other districts in terms of absolute revenue generated. Hohoe and Ketu North followed, recording approximately GH₵2.30 million and GH₵2.21 million, respectively.
The performance of these districts highlights their significant contribution to the region’s total internally generated revenue.
North Tongu, Akatsi South and Ketu North Record Strong Growth
Several districts recorded substantial increases in IGF between 2024 and 2025.
North Tongu’s IGF increased f apprromoximately GH₵879,588 to GH₵1.58 million, representing growth of about 79.9%. Akatsi South recorded an increase from GH₵1.04 million to GH₵1.64 million, while Ketu North rose from approximately GH₵1.41 million to GH₵2.21 million.
These increases contributed to the region’s overall revenue growth. However, the figures alone do not establish the causes of the improvements. Further analysis of revenue sources, collection efficiency, business activity and property rates would help explain the changes.
Keta Records a Significant Decline
Despite the region’s overall positive performance, not all districts recorded increases.
Keta experienced a substantial decline in IGF, falling from approximately GH₵2.51 million in 2024 to GH₵1.14 million in 2025. This represents a reduction of about GH₵1.37 million, or 54.6%.
The decline is particularly notable because Keta was among the region’s leading IGF generators in 2024. Its performance raises questions about the factors that influenced revenue collection during the 2025 financial year.
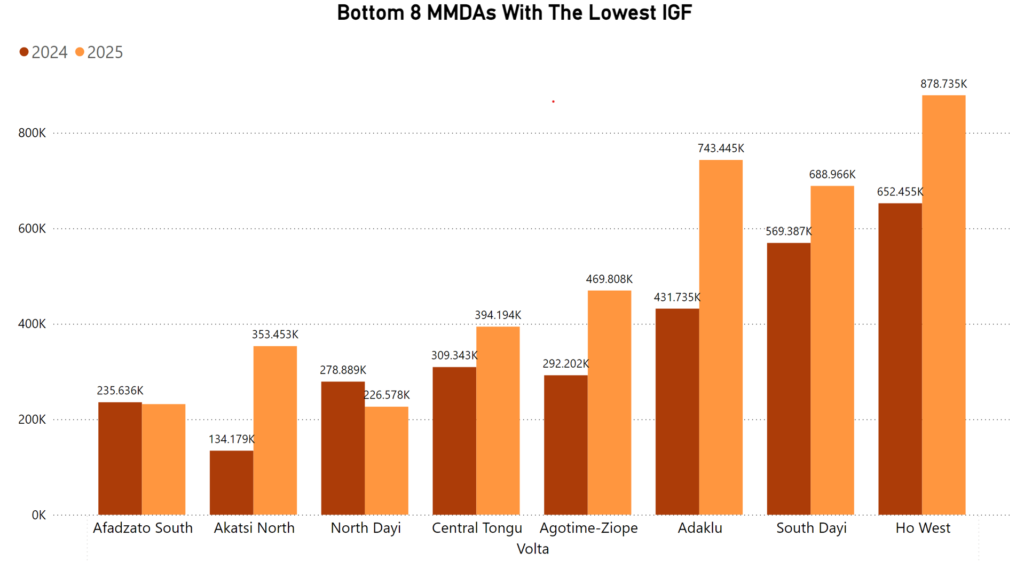
North Dayi also recorded a decline, with IGF falling from approximately GH₵278,889 to GH₵226,578. Afadzato South experienced a smaller decrease of about 1.6%.
Investigating these declines could help identify revenue collection challenges and opportunities for improvement.
Lower-Revenue Districts Show Promising Growth
An important finding from the analysis is that some districts with relatively low IGF collections recorded substantial percentage increases.
Akatsi North recorded the highest percentage growth among the 18 districts, increasing its IGF from approximately GH₵134,179 in 2024 to GH₵353,453 in 2025. This represents an increase of about 163.4%.
Adaklu and Agotime-Ziope also recorded strong growth, with increases of approximately 72.2% and 60.8%, respectively.
Although these districts continue to generate less revenue than the region’s leading assemblies, their growth rates highlight the importance of examining both the amount of revenue generated and the rate at which revenue changes over time.
It is also important to recognise that high percentage growth from a relatively low starting point does not necessarily translate into high absolute revenue.
What the Findings Mean for Revenue Mobilisation
The analysis points to three important considerations for the Volta Region.
First, the concentration of IGF among a relatively small number of districts highlights the importance of understanding the revenue sources and collection practices that contribute to their performance.
Second, districts experiencing declining collections may benefit from further investigation into their revenue sources, collection systems and economic conditions. The available figures identify where declines occurred but do not, on their own, explain why they happened.
Third, the strong growth recorded by some lower-revenue districts provides an opportunity to examine whether their revenue mobilisation approaches could offer useful lessons for other assemblies.
A more detailed assessment incorporating population, business registrations, property valuations, market revenue, fees and licences, and collection efficiency would help establish a stronger basis for comparing district performance.